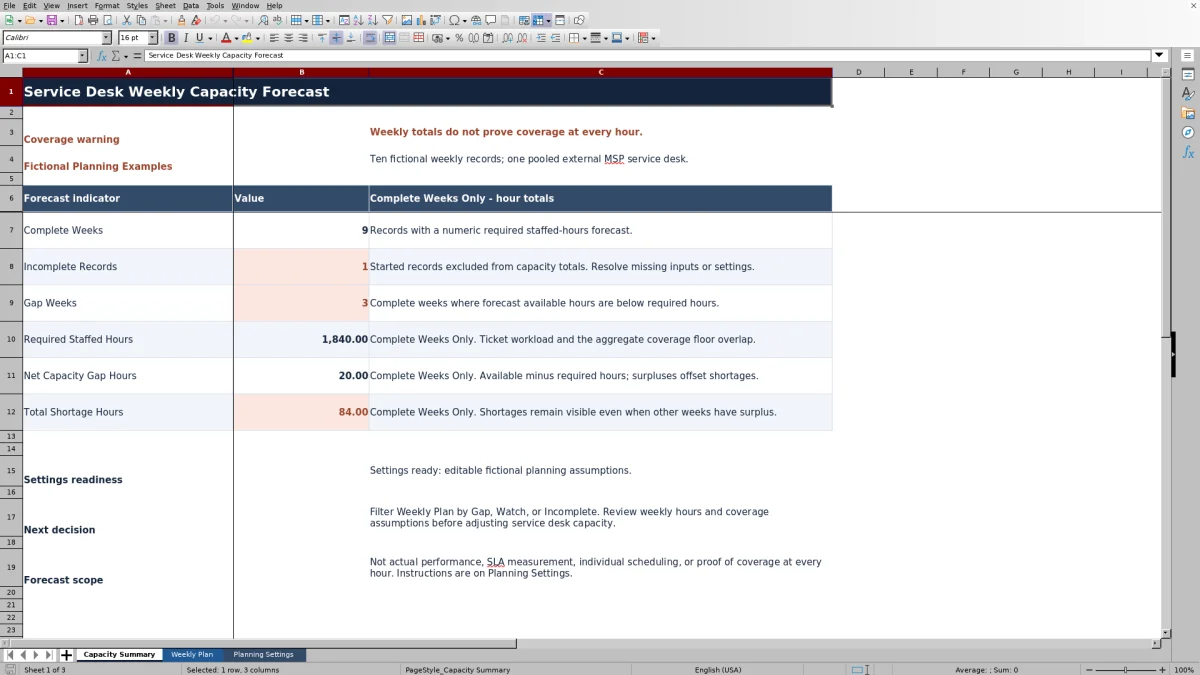
Check whether your service desk has enough staffed hours for the weeks ahead. This Excel capacity planner helps you compare forecast ticket workload and coverage needs with the hours available to one pooled managed service provider (MSP) service desk.
Enter weekly ticket estimates, handling time, coverage assumptions, and available staffed hours. The workbook calculates required hours, capacity gaps, and planning statuses so you can investigate shortages before adjusting capacity. Its ten sample records and two initial settings are fictional and should be replaced before operational use.
When to use this workbook
- Translate ticket volume and handling time into a weekly staffed-hours forecast.
- Account for an aggregate coverage floor without adding overlapping ticket workload twice.
- Identify shortage weeks and weeks with limited forecast headroom.
- Keep total shortage hours visible even when other weeks have surplus capacity.
What is in the file
How to use the workbook
1. Review the planning assumptions
Open Planning Settings and replace the fictional values for Ticket Work Share of Staffed Time and Headroom Warning Threshold. The ticket work share must be greater than 0% and no more than 100%; the warning threshold must be between 0% and 100%.
2. Replace the sample weekly inputs
In Weekly Plan, replace the fictional records in rows 2–11. Enter one unique Monday date per pooled-desk week in columns A–F, along with forecast tickets, handling minutes per ticket, weekly coverage hours, minimum concurrent seats, and available staffed hours. Use rows 2–101 for your records.
3. Check calculated hours and statuses
Leave the formulas in Weekly Plan columns G–K intact. Review Forecast Ticket Work Hours, Required Staffed Hours, Capacity Gap Hours, Capacity Headroom, and Planning Status. Resolve Incomplete records before relying on the totals.
4. Review shortages before changing capacity
Open Capacity Summary and compare Gap Weeks, Net Capacity Gap Hours, and Total Shortage Hours. Filter Weekly Plan by Gap, Watch, or Incomplete to investigate the underlying assumptions. Check coverage timing separately before treating a weekly total as an adequate staffing plan.
Define the pooled service desk before forecasting
Use this planner for one pooled external MSP service desk, with one record per week. Forecast Tickets and Available Staffed Hours should describe the same service scope. If you include a group of client tickets in demand but omit the hours available to support those clients, the resulting gap will not represent that pool accurately.
Weekly Coverage Hours describes the length of the weekly coverage window, not the sum of every technician's hours. Minimum Concurrent Seats represents the assumed minimum number of seats needed during that window. For example, 60 coverage hours with two concurrent seats creates a floor of 120 staffed hours. Enter these assumptions based on your contracted coverage; the workbook does not interpret contract terms.
Weekly totals do not prove hourly coverage. A pool can have enough hours in total but still have a shortage during an evening window or a concentrated arrival peak. Review the distribution of demand and staffing separately, especially where clients have different coverage windows or require skills that are not interchangeable.
Set realistic ticket-work and availability assumptions
In Planning Settings, Ticket Work Share of Staffed Time controls how much staffed time you expect to be available for ticket work. The fictional starting value is 75%. At that share, 180 hours of ticket work requires 240 staffed hours because only three-quarters of staffed time is assumed to support that work. This is an editable planning assumption, not a measured utilization result.
Enter Available Staffed Hours manually in Weekly Plan. Exclude leave and other unavailable time, but include normal non-ticket time. The ticket work share already allows for a portion of staffed time being spent away from ticket work. Reducing available hours for that same normal non-ticket time would count the allowance twice.
Use Handling Minutes per Ticket for work effort, rather than the elapsed time a ticket remains open. Choose a consistent handling-time basis for the ticket population being forecast. If the expected ticket mix changes, review both volume and average handling time instead of assuming that last week's average still represents the work.
Headroom Warning Threshold is a separate decision setting. Its fictional starting value of 10% marks nonnegative headroom below 10% as Watch. Changing this threshold changes the warning classification; it does not increase the calculated Required Staffed Hours.
Understand how workload becomes required staffed hours
The calculation starts by converting tickets into work hours: Forecast Tickets × Handling Minutes per Ticket ÷ 60. Weekly Plan displays this result as Forecast Ticket Work Hours. For 540 tickets at 20 minutes each, the forecast workload is 180 hours.
Required Staffed Hours then takes the larger of two requirements: Weekly Coverage Hours × Minimum Concurrent Seats, or Forecast Ticket Work Hours ÷ Ticket Work Share of Staffed Time. Coverage and ticket work overlap; they are not added. The model assumes ticket work can take place within the staffed coverage hours, subject to the ticket work share.
Capacity Gap Hours equals available staffed hours minus required staffed hours. A negative result is a shortage; a positive result is surplus forecast capacity. Capacity Headroom divides that gap by required staffed hours, expressing the difference relative to the requirement—not relative to available hours.
A negative gap produces Gap status. A nonnegative gap with headroom below the warning threshold produces Watch; headroom at or above the threshold produces Sufficient. Hours are rounded to two decimal places, and the headroom ratio is rounded to four decimal places. Treat these as planning outputs, not a substitute for checking the quality of the inputs.
Example: the same demand with different available hours
The fictional records for the weeks starting September 28, October 5, October 12, and October 19, 2026, share these inputs: 540 forecast tickets, 20 handling minutes per ticket, 60 weekly coverage hours, and two minimum concurrent seats. With a 75% ticket work share and a 10% warning threshold, each week has 180 ticket work hours, a 120-hour coverage floor, and a 240-hour staffed requirement.
- September 28: 216 available staffed hours produces a −24-hour gap, −10% headroom, and Gap status.
- October 5: 240 available staffed hours produces a zero-hour gap, 0% headroom, and Watch status.
- October 12: 264 available staffed hours produces a 24-hour surplus, 10% headroom, and Sufficient status.
- October 19: 300 available staffed hours produces a 60-hour surplus, 25% headroom, and Sufficient status.
The second week meets the calculated requirement exactly but still receives Watch because it has no headroom against the 10% threshold. The third week meets that threshold exactly, so it receives Sufficient. These labels help you distinguish an outright shortage from a plan with little tolerance for demand or availability changes.
Across these four records alone, required hours total 960, net capacity gap is positive 60 hours, and total shortage remains 24 hours. A positive overall balance does not remove a shortage week. Before adding hours to September 28, check whether its forecast and available-hours entry are sound and whether any proposed capacity can actually cover that week's needs.
Read the summary without hiding incomplete weeks or shortages
Capacity Summary includes hour totals only for records with a numeric Required Staffed Hours result. Complete Weeks counts those records; it is a calculation-completeness measure, not confirmation that the inputs have been operationally reviewed. Check Incomplete Records alongside the totals so missing weeks do not create a falsely reassuring picture.
Net Capacity Gap Hours adds positive and negative weekly gaps together. It answers whether available hours exceed required hours across the included records in aggregate. Total Shortage Hours adds only the magnitudes of negative gaps, keeping the amount of forecast shortage visible even when surplus weeks offset it in the net figure.
Review shortages before the net balance. Filter Weekly Plan to Gap and examine demand, coverage assumptions, and available hours for each affected week. Then review Watch records for limited headroom and Incomplete records for missing inputs. A surplus later in the plan should not be treated as coverage for an earlier shortage unless you have a workable operational change outside the spreadsheet.
If there are no numeric required-hours forecasts, the summary hour totals remain blank. This means there is no complete forecast to total; it is different from a completed forecast showing zero required hours or zero shortage.
Troubleshooting blank results, zero requirements, and input errors
If a started row shows Incomplete, first check all six input fields in Weekly Plan columns A–F. They must contain numeric values for the workload formula to calculate, including an Excel date in Week Starting. A date pasted as text can look correct while still preventing calculation. Entirely blank input rows remain blank rather than being marked Incomplete.
Next, check Planning Settings. Missing or invalid settings suppress required-hours and downstream capacity results and mark started records Incomplete. Enter percentages correctly: 75% or 0.75 represents the initial ticket work share; entering 75 does not. Both settings must be valid, even though the warning threshold is used for status rather than required-hours arithmetic.
Blank headroom is not always missing data. When Required Staffed Hours is zero, Capacity Headroom is deliberately blank because the ratio has no nonzero denominator. With valid nonnegative available hours, that completed row is Sufficient. Check why the requirement is zero before accepting it. Zero tickets alone does not eliminate coverage demand: 60 coverage hours and two seats still require 120 staffed hours, so 100 available hours would leave a 20-hour shortage.
Review pasted data manually because pasting can bypass Excel validation. Use unique Monday dates, nonnegative whole ticket counts, positive handling minutes, positive whole seat counts, coverage between 0 and 168 hours, and nonnegative available staffed hours. A numeric result does not prove that every entry meets those rules. If results appear stale, confirm that your spreadsheet application has recalculated the workbook and spot-check a known example before using the totals.
Comparison: this planner versus a blank spreadsheet
A blank spreadsheet is a realistic alternative when you need a custom forecasting model. This workbook is more structured around a specific task: estimating weekly capacity for one pooled service desk. The choice depends on whether that scope fits your decision or whether you need a different model.
| Method | Setup and calculations | Shortage review | Scope and maintenance |
|---|---|---|---|
| This Excel capacity planner | Prepared weekly inputs, editable planning settings, and formulas for workload, required hours, gaps, and headroom. | Separate net-gap and total-shortage summaries, plus weekly planning statuses. | 100 prepared weekly rows for one pooled desk; inputs and assumptions require manual review. |
| Blank spreadsheet | You design the inputs, formulas, units, and checks yourself. | You decide how to distinguish shortages, surpluses, and incomplete records. | Can be designed for a different scope, but you must build and maintain that logic. |
Use this planner when its weekly pooled-desk model matches the question you need to answer. Consider a custom model when you need separate demand segments, changing coverage requirements within a week, or other logic not represented here. For individual shift assignments or actual service-level tracking, use a process or system designed for those tasks; a weekly hours forecast alone does not establish either.
Frequently asked questions
How many weeks can I plan in the workbook?
Weekly Plan has 100 prepared records in rows 2–101, with formulas, validation ranges, and an autofilter covering that area. The summary formulas also reference those rows. Do not assume that records added below row 101 will be included; extending the model requires reviewing the formulas and supporting ranges.
Does the workbook import tickets or calculate available technician hours?
No automated import or connection is provided. You enter forecast tickets, handling minutes, coverage assumptions, and available staffed hours manually. Prepare those values from your own service delivery records and staffing information, then check that they use the same weekly scope before entering or pasting them.
Does Sufficient status mean we will meet our SLA?
No. Sufficient means the weekly forecast meets the workbook's headroom rule, or has zero required hours. It does not measure a service-level agreement (SLA), actual response or resolution performance, or coverage at every hour. The workbook calculates neither a business-hours nor an elapsed-time SLA clock.
Can I test different ticket work shares?
Yes. Ticket Work Share of Staffed Time in Planning Settings is editable and applies to the weekly calculations throughout the workbook. A lower share increases the ticket-driven staffed-hours requirement, although the final requirement may remain unchanged if the coverage floor is still larger. Save separately named copies if you need to retain different assumption sets for comparison.
Can I enter a separate row for every client in the same week?
That is not the supplied model. It expects one unique Monday date per pooled-desk week, rather than multiple client records for the same date. Combine demand and available hours consistently for the pool being planned. If clients cannot reasonably share capacity, review them through separate planning models rather than treating their hours as interchangeable.
About the authors

Tessa WhitlockClient & service operations
More about this area of the library →
Nathan CalderwoodService economics & planning
More about this area of the library →