Before a client review, check whether contracted services are enabled and actively used. This Excel service adoption tracker helps you compare aggregate counts across clients and identify where setup or adoption needs attention.
Built for managed service provider (MSP) customer success and service delivery teams, the workbook turns manually entered snapshots into rates, status labels, and a portfolio summary. You define active use, verify the counts, and record the next action.
When to use this workbook
- Separate enablement shortfalls from usage gaps so you can choose an appropriate follow-up.
- Keep contracted, enabled, and active counts together for each client-service pair.
- Identify incomplete, inconsistent, or stale snapshots before relying on adoption results.
- Review on-target records alongside exclusions rather than treating every entry as usable evidence.
What is in the file
How to use the workbook
1. Set your review assumptions
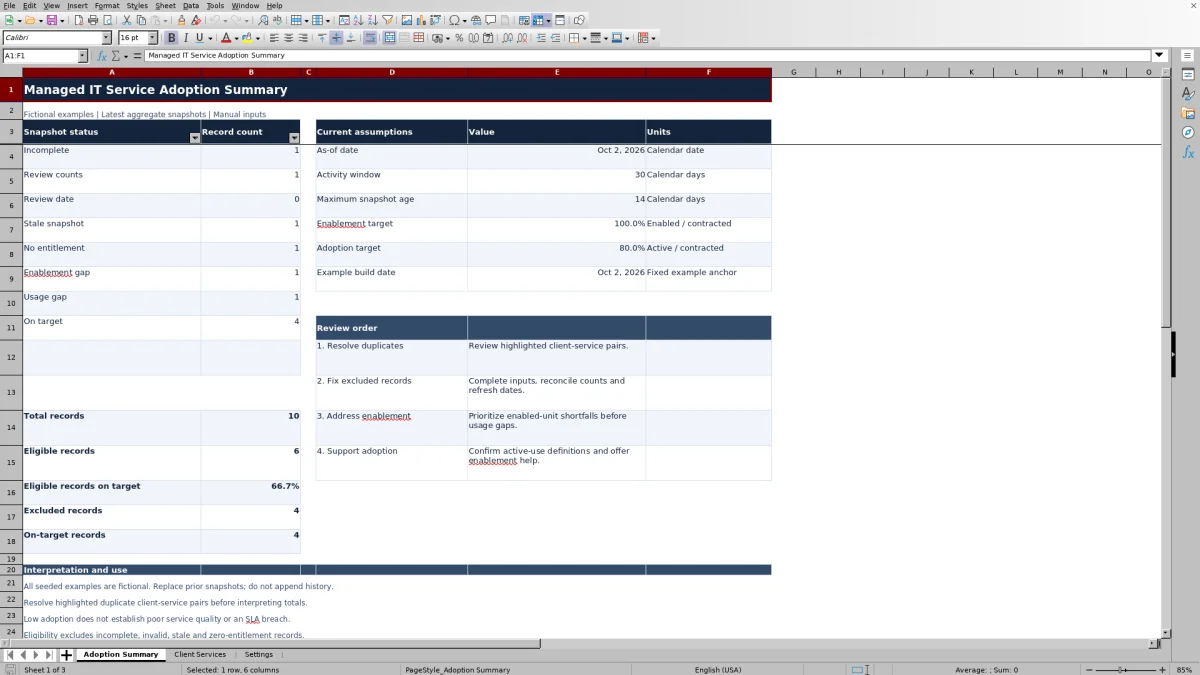
In Settings, review As-of date, Activity window days, Maximum snapshot age days, Enablement target, and Adoption target. The starting assumptions are 30 calendar days of activity, a maximum snapshot age of 14 calendar days, 100% enablement, and 80% adoption. These are editable planning assumptions, not contractual requirements.
2. Define services and active use
Replace the fictional service catalog in Settings with your services, units, and active-use definitions. Confirm what qualifies a user, device, or workload as active before collecting counts. The catalog provides 10 service slots.
3. Enter the latest aggregate snapshots
In Client Services, replace the fictional examples. Complete Client label through Active units, using one latest row per client-service pair. Use pseudonymous client labels and retain the formulas in Enablement rate, Adoption rate, and Status. Enter your follow-up manually in Next action.
4. Resolve issues and review the summary
Resolve highlighted duplicate pairs, then correct incomplete inputs, inconsistent counts, and date problems. In Adoption Summary, review excluded records before interpreting the eligible-record results. Address enablement gaps before usage gaps, and replace each prior snapshot when you refresh the review.
Keep each snapshot comparable and actionable
Use one latest snapshot per client-service pair. A client with three services needs three rows, but an updated snapshot for an existing pair should replace the previous one. Appending monthly history would cause the summary to count multiple records for the same relationship.
Keep all three counts in the same unit. For a device-based service, contracted, enabled, and active counts must all describe devices—not a mixture of devices and users. Confirm that the Unit selected in Client Services matches the service catalog; the presence of dropdowns does not replace that check.
Use the manual Next action field to capture a specific follow-up, such as confirming why contracted devices have not been enabled. The status calculation identifies a condition, not its cause, and does not create or assign work elsewhere.
Define active use before collecting counts
An enabled service is available to use; an active unit must also meet your service-specific activity definition. In Settings, document that definition beside the service and unit. The fictional examples use distinct users with at least one collaboration session or distinct devices and workloads with at least one completed backup during the activity window.
The activity window is inclusive: it runs from the snapshot date minus the configured number of days plus one through the snapshot date. For a 30-calendar-day window ending October 2, 2026, count qualifying activity from September 3 through October 2, 2026. Count distinct qualifying units, not the total number of sessions or backup events.
You supply the aggregate result. Changing Activity window days does not retrieve activity or recalculate the manually entered Active units. Recollect or verify those counts when the definition or window changes, so the displayed assumptions still describe the evidence.
Read rates and status labels in the right order
Both rates use contracted units as the denominator. Enablement rate is enabled units divided by contracted units; Adoption rate is active units divided by contracted units. Adoption is therefore not the percentage of enabled units that used the service.
For an otherwise eligible record, the workbook checks enablement before adoption. If enabled units fall below the enablement target, Status shows Enablement gap even when adoption is also below target. Usage gap applies when enablement meets its target but adoption does not. On target means both configured thresholds are met.
Use that order to guide investigation. First confirm the contracted scope and any setup barriers; then examine usage. The targets are editable planning assumptions. An On target label is not proof of service quality, and low adoption alone does not establish a service-level agreement (SLA) breach.
Example: Decide whether to address setup or usage
For a reproducible fictional review, set As-of date to October 2, 2026, keep the 30-calendar-day activity window and 14-calendar-day freshness limit, and use targets of 100% enablement and 80% adoption. Assume each row has complete, valid inputs and a snapshot date of October 2, 2026.
- Device backup: 100 contracted devices, 60 enabled devices, and 50 active devices produce 60% enablement and 50% adoption. Status is Enablement gap. Investigate the 40 devices not yet enabled before treating the issue as usage alone.
- Collaboration: 50 contracted users, 50 enabled users, and 20 active users produce 100% enablement and 40% adoption. Status is Usage gap. Confirm the activity definition and investigate why enabled users are not qualifying as active.
- A second collaboration record with 100 contracted users, 100 enabled users, and 85 active users produces 100% enablement and 85% adoption. Status is On target under these assumptions.
If these are the only populated records, Adoption Summary shows three eligible records and one on-target record, or 33.3% eligible records on target. That result describes client-service records, not users or devices. It neither averages the row adoption rates nor combines unlike units into a portfolio usage rate.
Troubleshooting missing rates and excluded records
A blank rate is not necessarily zero adoption. The workbook displays rates only for Enablement gap, Usage gap, and On target records. Check Status first, then correct the underlying inputs:
- Incomplete: fill all seven required fields from Client label through Active units. A Next action note does not make an incomplete snapshot eligible.
- Review counts: use numeric, nonnegative counts and verify that active units do not exceed enabled units and enabled units do not exceed contracted units. Count-entry validation permits whole numbers from 0 through 1,000,000.
- Review date: enter a valid Excel date no later than As-of date. Also check pasted values manually; entry validation and formula checks are not a substitute for source verification.
- Stale snapshot: refresh the evidence and enter its actual snapshot date. Do not change the date alone to make old counts appear current.
- No entitlement: a complete, otherwise valid row with zero contracted units is excluded from rate calculations. Confirm whether the service belongs in the current contracted scope.
Correcting one issue may reveal another because the status checks run in sequence. A valid zero Active units count with positive contracted units can produce a genuine 0% adoption rate; blank rates on excluded rows mean something different.
Duplicates are highlighted, not removed from totals. Resolve repeated client-service pairs before interpreting the summary. If no records are eligible, Eligible records on target is blank because there is no eligible denominator—not because performance is 0%.
Use the summary without overstating the evidence
Adoption Summary groups records by status. Eligible records include Enablement gap, Usage gap, and On target; incomplete, invalid, stale, and zero-entitlement records are excluded. Review the excluded count alongside the on-target percentage. A favorable result based on a small eligible subset may leave much of your portfolio unassessed.
The As-of date in Settings starts with TODAY(), so snapshot age can change when the workbook recalculates on a later date. The fixed Example build date in Adoption Summary is only an example anchor. For a dated review, set an explicit As-of date and save a separately named copy if you need to preserve that review state.
The supplied formulas cover 100 snapshot rows, and the service dropdown uses 10 catalog slots. Do not assume extra rows are included. Extending the workbook requires checking formulas, summary ranges, validation, filters, and formatting. It is a current-snapshot tool, not an automatic history or audit system. Keep contacts, credentials, and operational logs out of it; use only the aggregate data needed for the review.
Comparison: This tracker or a blank spreadsheet?
A blank spreadsheet is a realistic alternative when you need a different record structure or bespoke measures. This workbook supplies a defined review method, but you still collect the evidence, verify it, and decide what action to take.
| Method | Setup and calculations | Data-quality review | Scope and maintenance |
|---|---|---|---|
| MSP service adoption tracker | Prepared rate formulas, status logic, and an eligible-record summary | Input validation, exclusion statuses, and duplicate-pair highlighting; manual verification remains necessary | 100 latest snapshot rows and 10 service slots; updates replace prior snapshots |
| Blank spreadsheet | You design the fields, calculations, and summary measures | You create any checks and decide how invalid or duplicate records affect results | You design capacity and history handling, then maintain the relevant formulas and ranges |
Choose this tracker when its aggregate counts, shared targets, and latest-snapshot approach fit your review. Start with a custom spreadsheet when you need a materially different model. If you require automated activity collection or assigned follow-up workflows, evaluate tools that explicitly support those needs; this workbook does not monitor systems or send notifications.
Frequently asked questions
Does the tracker collect service activity automatically?
No. You manually enter contracted, enabled, and active aggregate counts. The workbook calculates rates, statuses, and summary results from those entries; it does not infer activity or verify source systems.
Can I use different adoption targets for different services?
The supplied status formulas use the shared Enablement target and Adoption target in Settings. The service catalog holds each service's unit and active-use definition, but it does not provide service-specific target fields. Keep that distinction in mind when reviewing services with different expected usage patterns.
Does the summary show the percentage of clients on target?
No. It shows the percentage of eligible client-service records that are on target. A client with several services contributes several records, so the result is not a unique-client percentage or a unit-weighted adoption measure.
Can I keep monthly history in Client Services?
Not within the workbook's intended record structure. Replace the prior snapshot for each client-service pair rather than appending another month. Save separate dated copies if you need review baselines; the workbook does not automatically maintain a historical trend or audit trail.
Does an active backup device prove that backups are healthy?
No. Under the fictional catalog definition, a device is active if it has at least one completed backup during the activity window. That count does not establish backup frequency, recoverability, or compliance with a client's contractual requirements. Verify service health separately using the evidence appropriate to the service.
About the authors

Tessa WhitlockClient & service operations
More about this area of the library →
Nathan CalderwoodService economics & planning
More about this area of the library →