Turn monthly support figures into a clear client conversation about service outcomes, recent changes, and next actions. This Excel template helps you, as a managed service provider (MSP) account manager, prepare an executive service report for one client using manually entered source figures.
Enter the monthly counts and business-facing commentary, then select the reporting month to display its results. The workbook calculates initial response attainment and positive survey rates, compares them with the previous calendar month, and surfaces input issues to review before sharing.
When to use this workbook
- Keep monthly support results and business commentary together for one client review.
- See whether response attainment and survey sentiment improved from the previous calendar month.
- Use editable review targets to focus discussion on results that need attention.
- Identify missing inputs and highlighted exceptions before publishing the report.
What is in the file
How to use the workbook
1. Set the client and reporting assumptions
On Settings, replace the fictional client display name and review the response and survey targets. Update the business-hours calendar description, eligible-response definition, and positive-survey definition to match the agreed reporting basis. Source figures must already reflect these definitions; the workbook does not apply a business-hours calendar to ticket timestamps.
2. Enter one record per month
On Monthly Results, replace the fictional records with your client's figures. Use a unique first-of-month date, such as September 1, 2026. Enter the counts in columns B through I, including the applicable initial response threshold in business minutes. Enter month-end backlog independently, and preserve the formulas in columns J, K, and N.
3. Add the business explanation
Complete Business outcomes and Risks and next actions on Monthly Results. Explain what the figures mean for the client, distinguish confirmed findings from possible causes, and state what needs to happen next. Do not leave fictional commentary in a client-facing report.
4. Select, reconcile, and review
Choose the reporting month in Executive Report B3. Check the displayed results against source reports, inspect Data readiness and Review status, and resolve highlighted exceptions. Confirm that the previous calendar month's record exists before interpreting the rate changes. Ready is not approval to publish.
Keep the monthly reporting basis consistent
Before entering figures, agree on which support activity belongs in the report. Tickets opened, tickets closed, eligible initial responses, and survey responses are different populations. Do not use the opened-ticket count as the response-rate denominator merely because it is readily available. Use the eligible-response definition recorded on Settings and count each eligible ticket consistently.
The Initial response target (business minutes) field on Monthly Results records the threshold applicable to that month. A threshold of 30 business minutes is not necessarily 30 elapsed minutes: the source report must already account for the agreed working calendar, holidays, and time zone. Changing the calendar description in Settings does not recalculate the source counts.
Separate the response threshold from the attainment target. The monthly threshold measures how quickly an initial response must occur. The Settings review target is the proportion of eligible responses you want to see within that threshold. These editable review assumptions are not contractual service-level agreement (SLA) defaults. If the threshold or eligibility rules change, explain the change before presenting two months as directly comparable.
Read calculated rates without overstating them
Initial response attainment divides Initial responses within target by Eligible initial responses. Positive survey rate divides Positive survey responses by Survey responses received. You enter the underlying counts; the workbook calculates the two rates. Neither rate is an average response time, a resolution-time measure, or a system-availability measure.
The Executive Report compares these rates with the previous calendar month, not simply the previous populated record. It subtracts the previous rate from the selected rate and multiplies by 100 to show the change in percentage points. A rise from 80% to 90% is 10.0 percentage points, not a 10% relative increase.
A blank rate means the month or required counts are missing, or the denominator is zero. It does not mean 0% performance. By contrast, zero responses within target out of a positive eligible count produces a genuine 0% rate. A change remains blank if either comparison rate is unavailable; do not describe that blank as no change.
Example: interpret the fictional September results
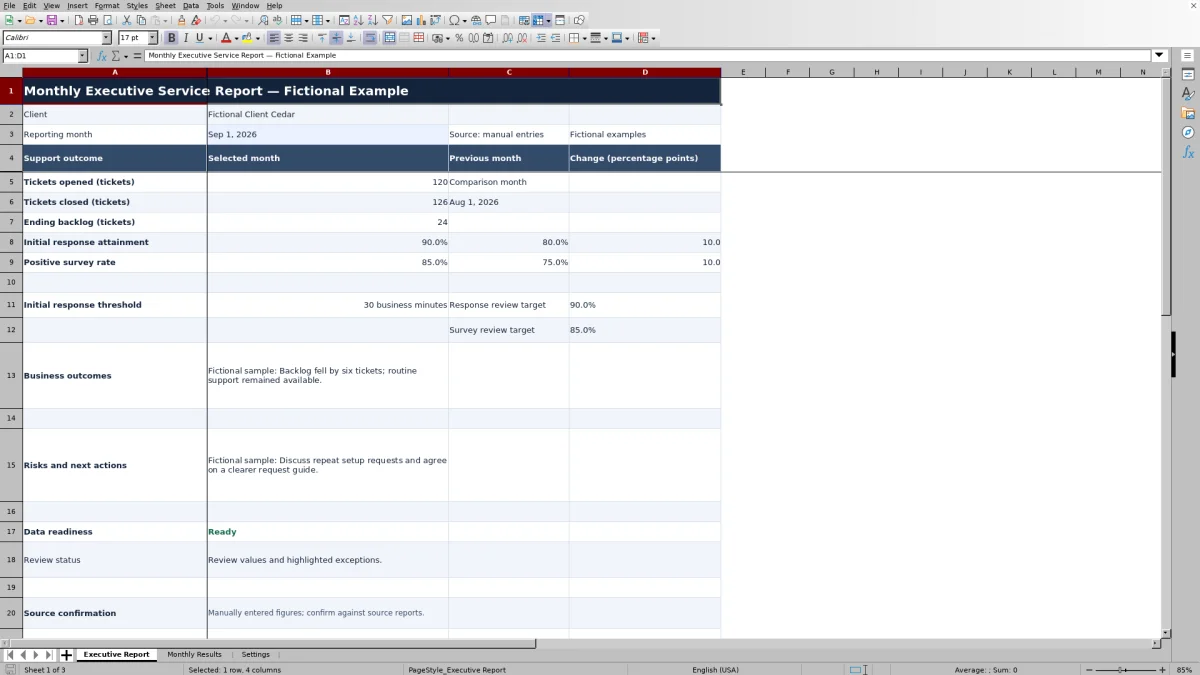
The supplied fictional September 2026 record groups these inputs: 120 tickets opened, 126 closed, an ending backlog of 24 tickets, 100 eligible initial responses, and 90 responses within a 30-business-minute threshold. It also records 17 positive survey responses out of 20 received. The August record contains 80 responses within target out of 100 eligible, 15 positive surveys out of 20, and an ending backlog of 30 tickets.
For September, 90 divided by 100 gives 90.0% initial response attainment. Dividing 17 by 20 gives an 85.0% positive survey rate. Against August's 80.0% and 75.0%, both rates increased by 10.0 percentage points. September equals the supplied review targets of 90% and 85%; equality is not below target.
The independently entered backlog counts also show a reduction of six tickets, from 30 to 24. That observation can inform your commentary, but the workbook does not calculate backlog from opened and closed tickets. Confirm the ending count against the source rather than deriving it solely from monthly activity.
A useful discussion would acknowledge the improved rates, then investigate the remaining response misses and any recurring request patterns. Keep the survey denominator visible in your reasoning: an 85% result from 20 responses describes those responses, not necessarily the experience of every supported user.
Write commentary that leads to a client decision
Use Business outcomes to explain the significance of the month's results, not just repeat the percentages. For example, a verified backlog reduction may support a discussion about fewer outstanding requests. It does not, by itself, establish improved productivity, financial savings, or uninterrupted service.
Use Risks and next actions to connect a concern with a proposed response. If repeat setup requests appear to be contributing to support demand, distinguish that hypothesis from a confirmed cause and propose a review of the request guidance. Where useful, include the proposed owner and review date in the text; these are manual notes, not assigned or tracked tasks.
Keep evidence and interpretation distinct. The workbook pulls your commentary into the selected month's report but does not generate explanations or validate their accuracy. Review both narrative fields even when all numeric inputs are present, because the readiness calculation does not check whether the commentary is complete.
Troubleshooting missing results and misleading status
- Missing monthly results: Check Executive Report B3 and the corresponding Month entry on Monthly Results. Use an actual first-of-month date, not text or a month-end date. A missing match can leave the results blank.
- Duplicate month warning: Keep one record per month for this client. Resolve duplicates before review because the lookup can return the first matching record rather than the record you intended.
- Incomplete readiness: Check all eight numeric inputs in columns B through I. A missing threshold or a count entered as text can keep the row incomplete. Enter zero only when the source confirms a zero count, not as a substitute for missing evidence.
- Ready with highlighted exceptions: Ready only means that all eight required numeric inputs are present for a dated row. It does not confirm valid counts, unique dates, accurate sources, or sensible numerator-denominator relationships.
- Unexpected rates or red highlights: Confirm that responses within target do not exceed eligible responses and positive surveys do not exceed surveys received. Also check whether a valid rate is below its review target; red highlighting can indicate performance below target as well as an input problem.
Pasted values can bypass data validation. Inspect highlighted exceptions after entry and recalculate the workbook before checking the executive view. If a previous-month comparison is blank, inspect that specific calendar month's record and denominators rather than replacing the blank with zero.
Use the prepared scope and review limits safely
The workbook is organized for one client's monthly service discussion, with prepared records in Monthly Results rows 2 through 101. Its executive lookups and reporting-month list use that range. Adding a record below row 101 alone will not bring it into the existing report logic. If you extend the workbook, review the formulas, selector range, validation, and formatting together before relying on the added rows.
Settings holds the current review targets, while each monthly row records its own business-minute response threshold. Changing a Settings target can change how an older selected month's result is judged. Save a separately named copy if you need to preserve the assumptions and report as issued; do not assume the workbook maintains historical versions.
This is a manually maintained reporting workbook, not a ticket queue, monitoring service, or messaging tool. Source reconciliation remains your responsibility. Before client use, verify recalculated values, the month selector, and exception highlighting in your spreadsheet application rather than assuming identical behavior across applications.
Comparison: this workbook or a blank spreadsheet
A blank spreadsheet is a realistic alternative when you need a highly customized client report. This workbook is useful when its existing measures fit your monthly discussion and you want a prepared reporting structure without building the rate and comparison logic yourself.
| Method | Setup effort | Calculations and review checks | Source handling | Best fit |
|---|---|---|---|---|
| This Excel workbook | Replace examples and agree on reporting definitions. | Prepared rates, previous-month changes, readiness status, validation, and exception highlighting. | Monthly source figures are entered and reconciled manually. | One-client reviews using the included support measures and commentary fields. |
| Blank spreadsheet | Design the layout, fields, formulas, and review process. | Only the calculations and checks you build. | Source handling depends on the process you design. | Reports needing materially different metrics, layouts, or reporting periods. |
Choose based on the reporting decision, not the presence of a template alone. The prepared workbook does not remove the need to confirm source definitions and results. A custom sheet offers more design freedom but leaves you responsible for creating and maintaining the calculation and review structure.
Frequently asked questions
Does the template import figures from our support system?
No. Source figures are entered manually on Monthly Results. You can use reports from your support system as the source, but confirm their reporting period, eligibility rules, business-hours basis, and survey definitions before entering the totals.
Can I report on several clients in the same workbook?
The workbook is designed for one client. It has one client display name and matches records by month, not by client and month. Use a separate copy for each client rather than mixing client records in Monthly Results.
Does the report include charts or trends for every metric?
No charts are included. The executive view shows previous-calendar-month rates and percentage-point changes for initial response attainment and positive survey rate. It displays the selected month's ticket counts, but it does not calculate executive-view trends for every measure.
Can I change the response and survey review targets?
Yes. Edit Settings B3 and B4 using percentages between 0% and 100%. These are operational discussion thresholds, not guarantees. Record the applicable response-time threshold separately in Initial response target (business minutes) on each Monthly Results row.
Does closing more tickets than we opened prove the backlog fell?
Not by itself. The workbook treats Ending ticket backlog as an independent manual input rather than calculating it from ticket activity. Confirm it against the month-end source count and investigate any differences caused by scope, reopened tickets, transfers, or reporting definitions before writing the outcome commentary.
About the authors

Tessa WhitlockClient & service operations
More about this area of the library →
Nathan CalderwoodService economics & planning
More about this area of the library →